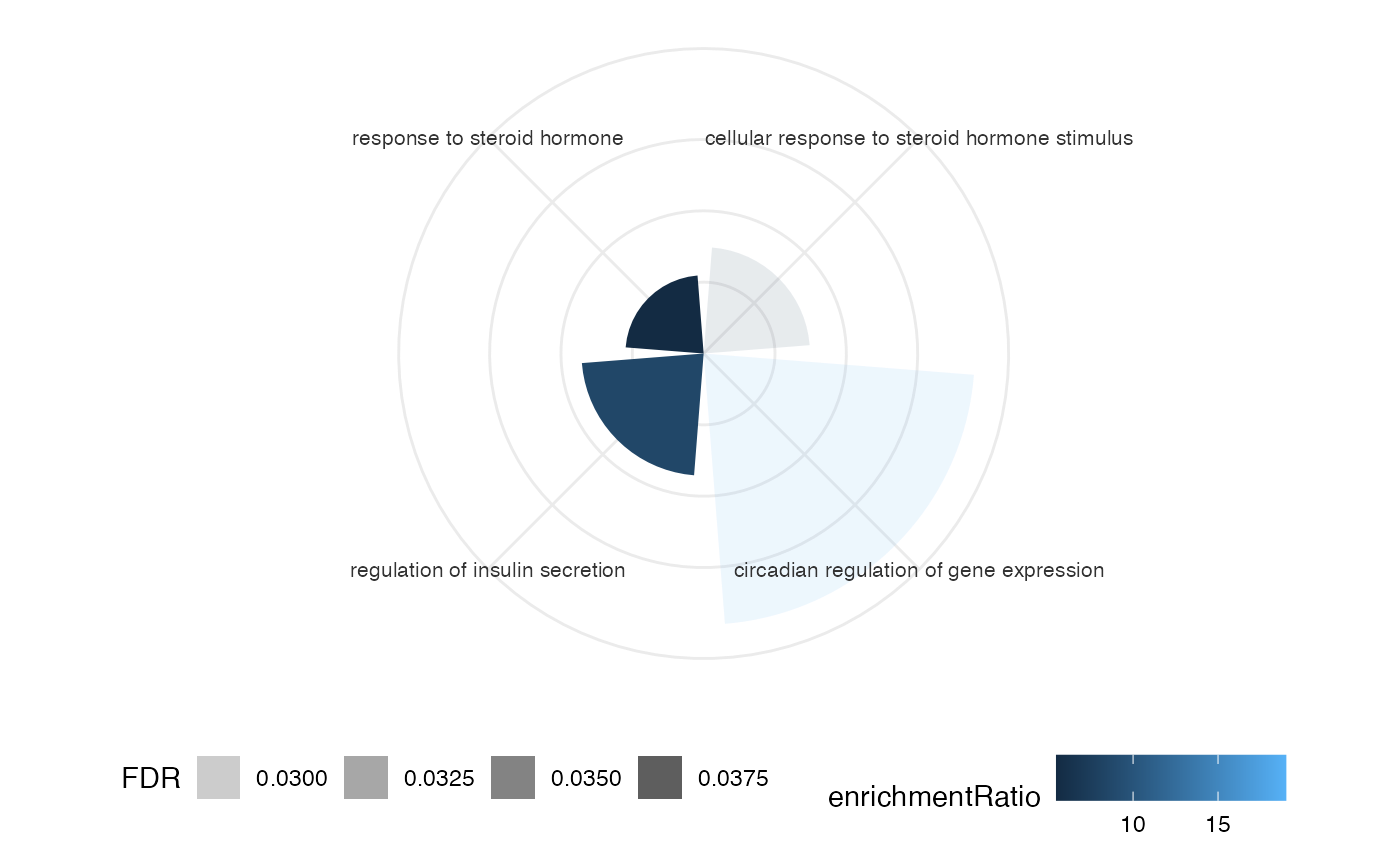
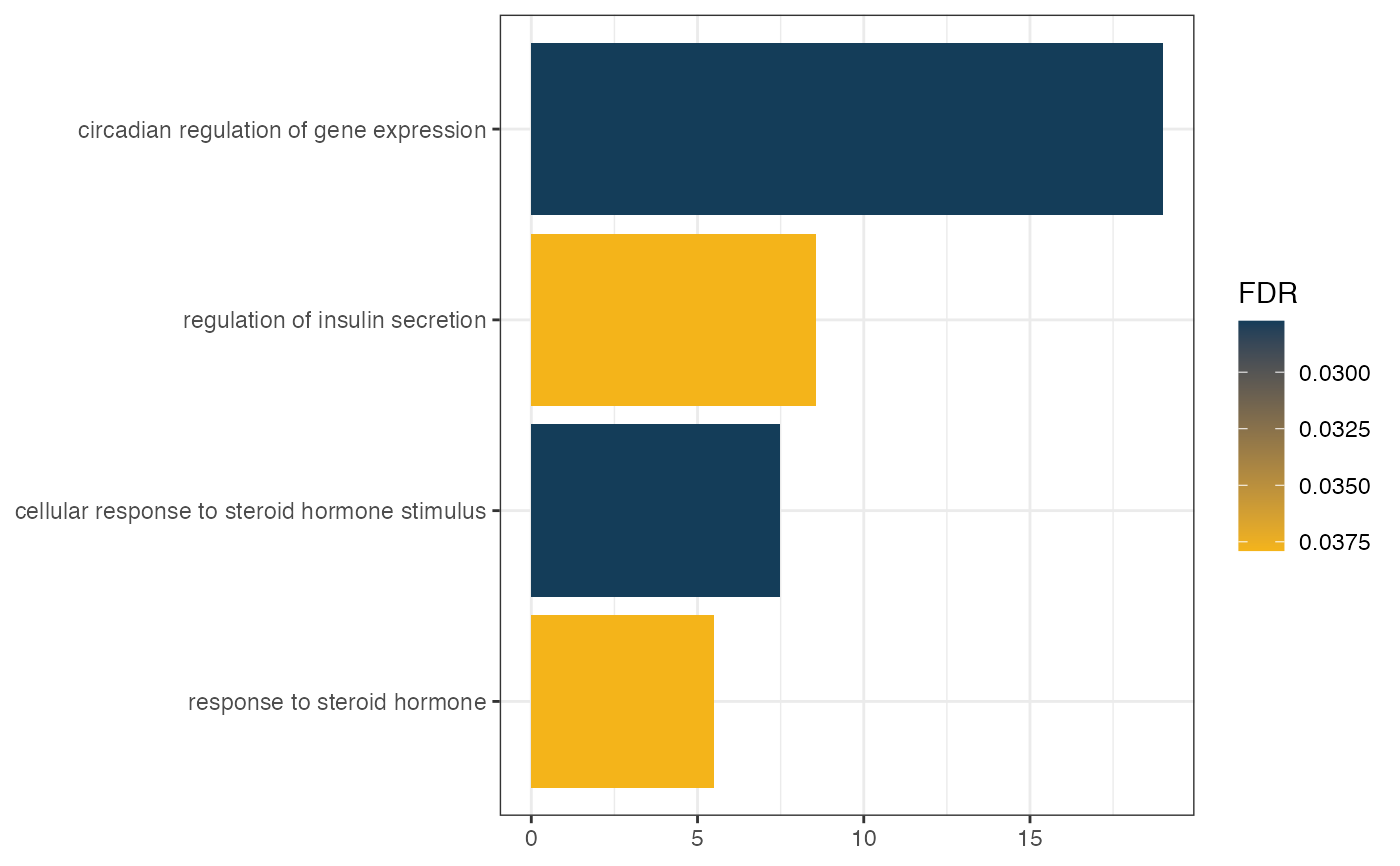
Plots to visualize the enrichment analysis results
enrichPlot.RdGenerate three types of plots to visualize the enrichment
analysis results from getEnrich function. The plots are an
circular barplot, barplot and dotplot.
enrichPlot(res, showCategory = 10, type = "circle")
Arguments
| res | A dataframe with |
|---|---|
| showCategory | Number of enriched terms to display (default: 10). |
| type | Type of plot: circle, bar or dot (default: circle). |
Value
Returns a circle, bar or dot plot of enrichment analysis results.
Examples
# loading enrichdemo data(enrichdemo) # circle barplot enrichPlot(res = enrichdemo$results, showCategory = 10, type = 'circle')# barplot enrichPlot(res = enrichdemo$results, showCategory = 10, type = 'bar')# dotplot enrichPlot(res = enrichdemo$results, showCategory = 10, type = 'dot')