Smear plot for Differentially Expressed genes and TFs
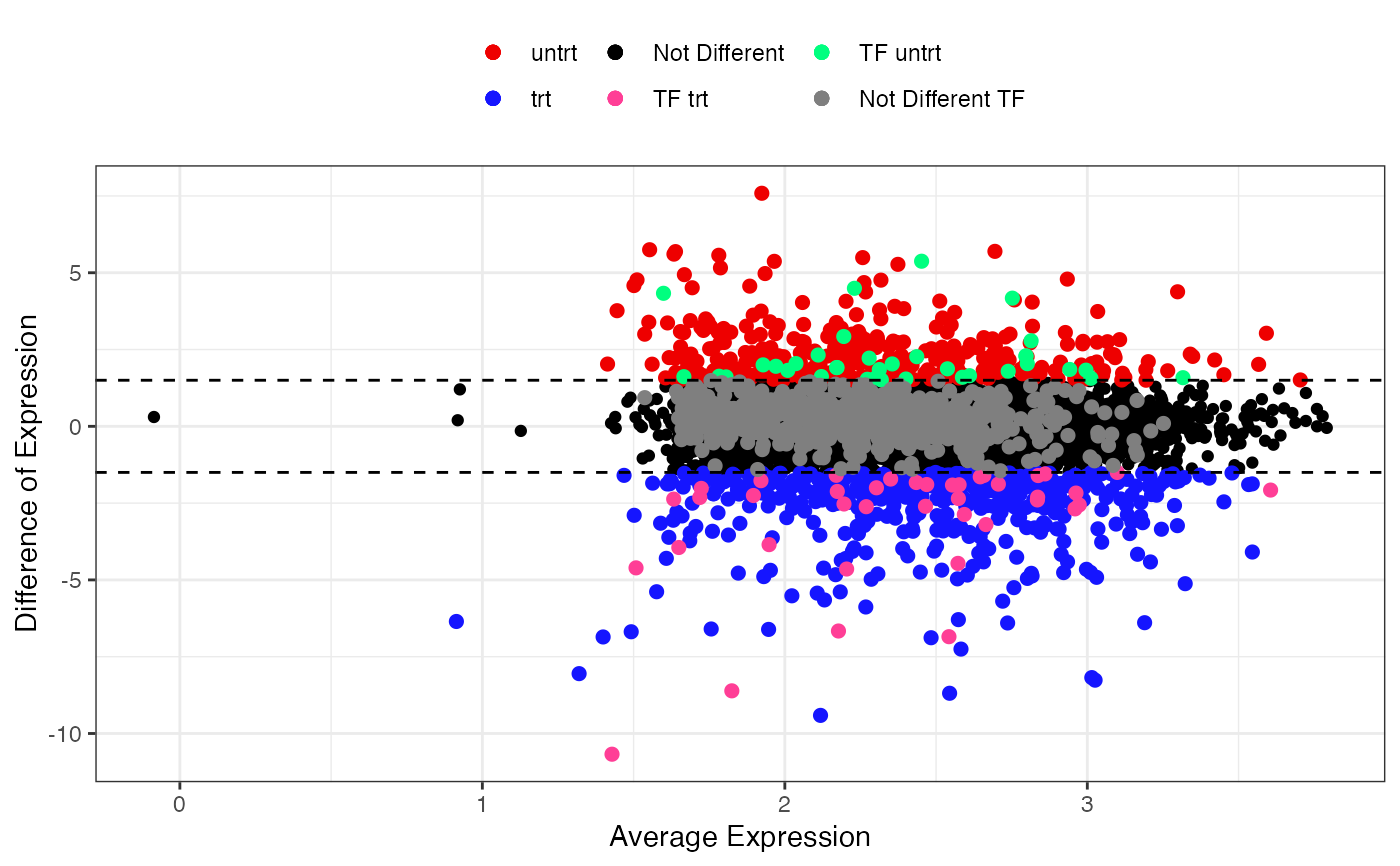
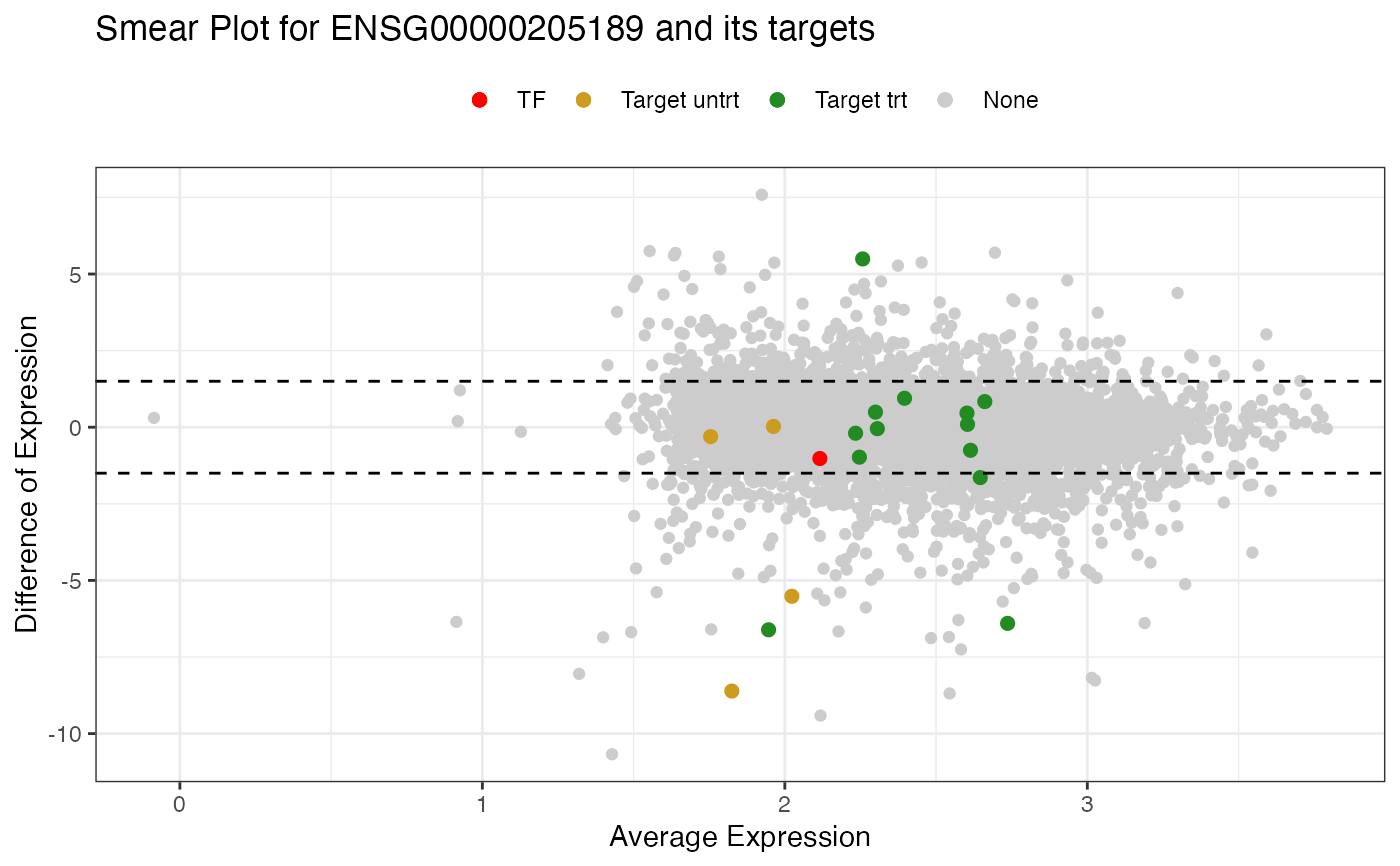
SmearPlot.RdGenerate an plot for Differentially Expressed (DE) genes and for specific TF that shows the relationship between log(baseMean) and Difference of Expression or log2FoldChange. This plot enables to visualize the distribution of DE genes and TF in both conditions.
SmearPlot(
  object,
  diffMethod,
  lfc = 1.5,
  conditions,
  TF = NULL,
  padjust = 0.05,
  label = FALSE,
  type = NULL
)
Arguments
| object | CeTF class object resulted from |
|---|---|
| diffMethod | Method used to calculate Differentially Expressed (DE)
genes (see |
| lfc | logFoldChange module threshold to define a gene as differentially expressed (default: 1.5). |
| conditions | A vector of characters identifying the names of conditions (i.e. c('normal', 'tumoral')). |
| TF | Specify a single TF to be visualized for (used only if type argument equals TF). |
| padjust | Significance value to define a gene as differentially expressed in DESeq2 diffMethod option (default: 0.05). |
| label | If label is TRUE, shows the names of single TF and its respectives (default: FALSE). |
| type | Type of plot (DE or TF). If DE, will plot the smear plot for all differentally expressed genes and TFs for both conditions, and if TF, will plot the smear plot for a specific TF and their targets. targets for both conditions (default: FALSE). |
Value
Returns an plot of log2(baseMean) by log2FoldChange or difference of expression for genes and TFs differentially expressed or for a single TF and its targets for both conditions.
Examples
# load the CeTF class object resulted from runAnalysis function data(CeTFdemo) #performing SmearPlot for DE genes and TFs SmearPlot(object = CeTFdemo, diffMethod = 'Reverter', lfc = 1.5, conditions = c('untrt', 'trt'), type = 'DE')#performing SmearPlot for DE genes and TFs SmearPlot(object = CeTFdemo, diffMethod = 'Reverter', lfc = 1.5, conditions = c('untrt', 'trt'), TF = 'ENSG00000205189', label = FALSE, type = 'TF')

